
Bellabeat Activity & Sleep Analysis
Exploring Fitbit activity and sleep data to identify behavioral patterns and potential opportunities for a wellness technology company
Project Overview
This case study was completed as the capstone project for the Google Data Analytics Professional Certificate and developed into a portfolio project using Google Sheets and Tableau Public.
The project examines smart-device activity and sleep data to identify patterns that could help Bellabeat better understand how consumers use fitness technology. The goal was not simply to summarize the dataset, but to look for useful relationships in daily activity and sleep behavior and consider how those findings might inform Bellabeat’s marketing strategy.
I focused the analysis on three questions:
- How does physical activity vary throughout the week?
- What patterns appear in users’ sleep behavior?
- Is there a meaningful relationship between sleep duration and physical activity?
Tools: Google Sheets, Tableau Public
Dataset: Fitbit Fitness Tracker Data, accessed through Kaggle. The dataset contains personal fitness tracker data from 30 eligible Fitbit users who consented to the collection of activity, sleep, and related metrics through a distributed survey conducted via Amazon Mechanical Turk.
Business Task
Bellabeat wants to better understand how consumers use smart fitness devices and how those behaviors could inform its marketing strategy. For this analysis, I used Fitbit activity and sleep data as a proxy for broader smart-device usage and looked for behavioral patterns that could translate into actionable insights for Bellabeat.
The primary objective was to identify trends in daily activity, activity intensity, and sleep, then determine which findings were strong enough to support practical marketing recommendations.
Because the dataset represents Fitbit users rather than Bellabeat customers, any recommendations are treated as directional rather than definitive.
Data & Preparation
The analysis uses the Fitbit Fitness Tracker Data dataset available through Kaggle. The data was collected in 2016 and includes daily activity, sleep, steps, calories, and activity-intensity measurements from a small sample of Fitbit users.
I focused primarily on two files:
- dailyActivity_merged.csv
- 941 daily activity records across 15 fields
- sleepDay_merged.csv
- 413 records after removing three duplicate rows
I first reviewed both datasets for duplicate records, missing values, formatting problems, and implausible ranges. The daily activity data contained no blank cells and no duplicate records. The sleep data contained three duplicates, which I removed before analysis.
To analyze sleep and activity together, I created a participant/date key and joined the sleep metrics to the corresponding daily activity records. This produced 410 matched daily observations across 24 participants.
I also created derived fields for day of week, weekday sorting, sleep efficiency, and sleep-duration categories to support the analysis.
Data Quality & Limitations
Several limitations affect how broadly the results can be interpreted.
The dataset is relatively small and dates from 2016. Although the activity data contains 941 daily records, those observations come from a limited number of participants rather than 941 independent users. Sleep coverage is narrower: only 24 participants had matched activity and sleep data, producing 410 matched daily observations.
Coverage also varied considerably between participants. Some contributed a full 31 days of matched data, while others contributed very few; nine of the 24 participants had fewer than 10 matched days. This means participants with more recorded days have greater influence on analyses using pooled daily observations.
The dataset also represents Fitbit users rather than Bellabeat customers and provides limited demographic information. As a result, the findings should be treated as exploratory and should not be generalized to Bellabeat’s broader target market without additional research.
These limitations informed how I interpreted the results, particularly when examining the apparent relationship between sleep duration and activity.
Analysis & Findings
Activity Varies Across the Week
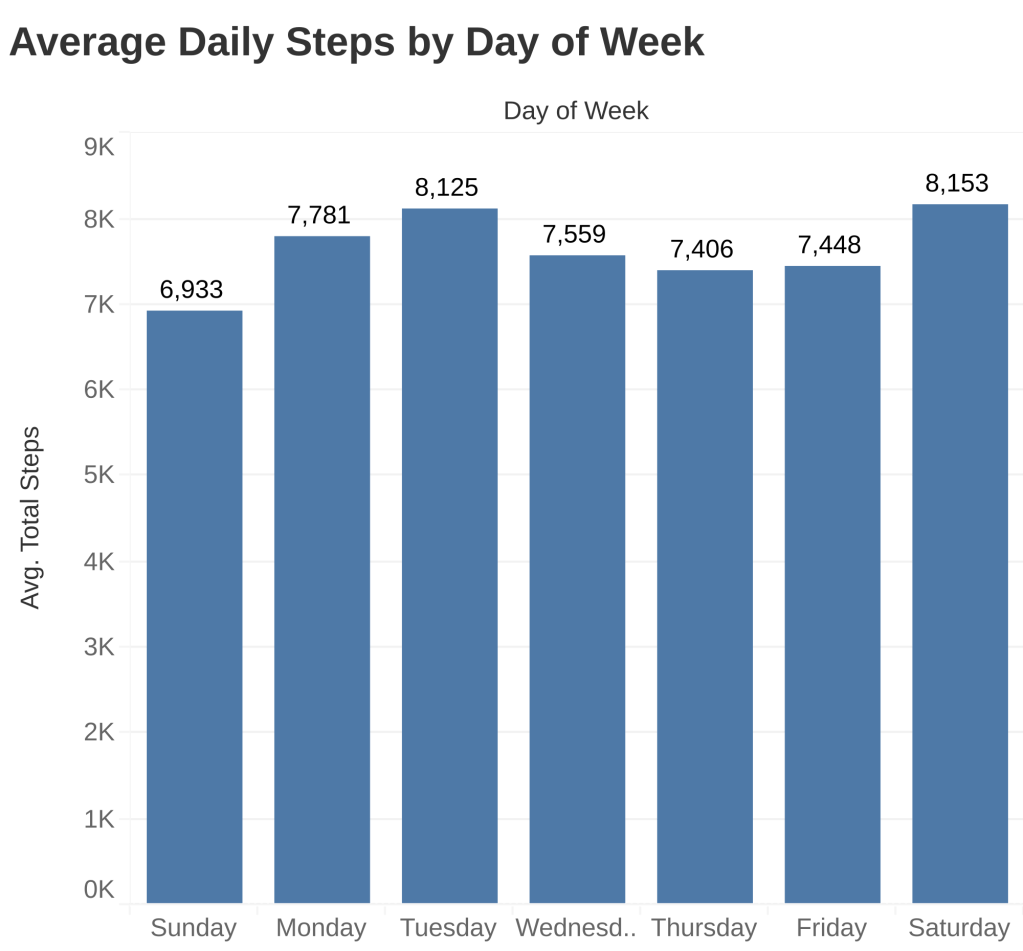
Saturday had the highest average at 8,153 steps, followed closely by Tuesday at 8,125. Sunday was the least active day, averaging 6,933 steps. Although Sunday showed the lowest average, weekday differences overall were relatively modest. Overall, participants averaged approximately 7,638 steps per day.
Activity Intensity Is Dominated by Light and Sedentary Time
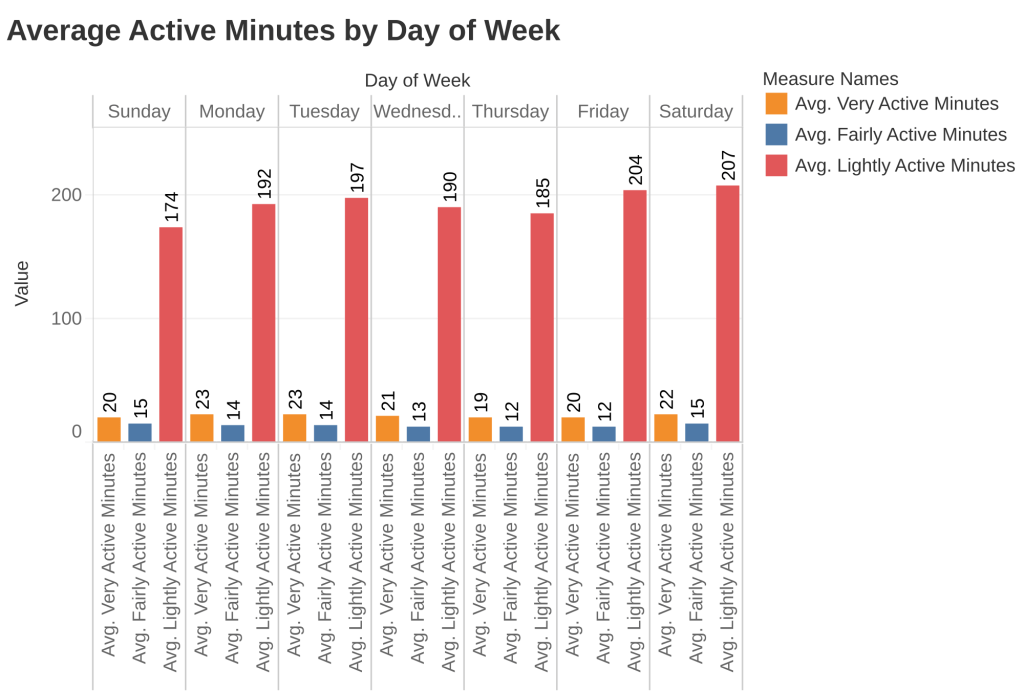
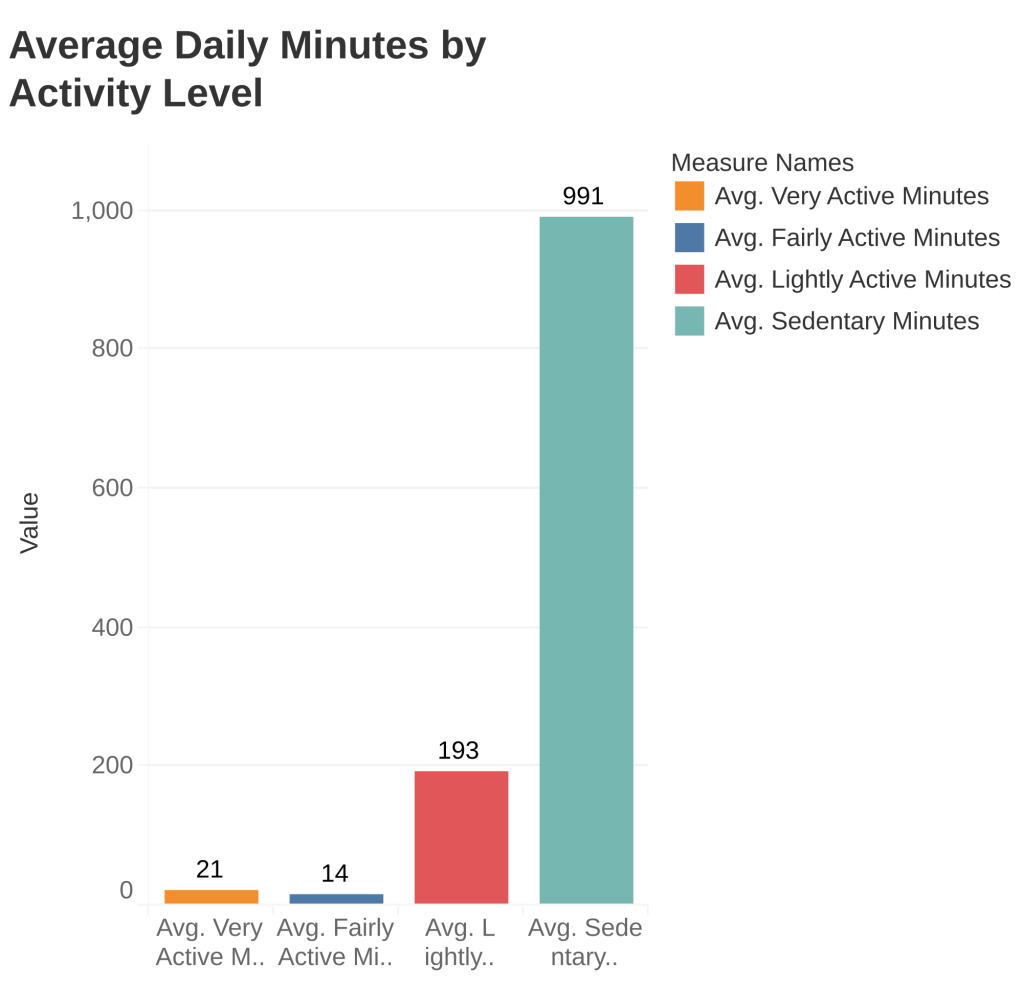
The activity-intensity data provides additional context beyond step counts. Participants averaged approximately 21 very active minutes, 14 fairly active minutes, and 193 lightly active minutes per day.
Sedentary minutes substantially exceeded time recorded in any individual active category, while light activity accounted for most active minutes.
The weekday analysis also showed relatively little variation in very and fairly active minutes, while light activity fluctuated somewhat more across the week.
Sleep Duration Varies More Than Sleep Efficiency
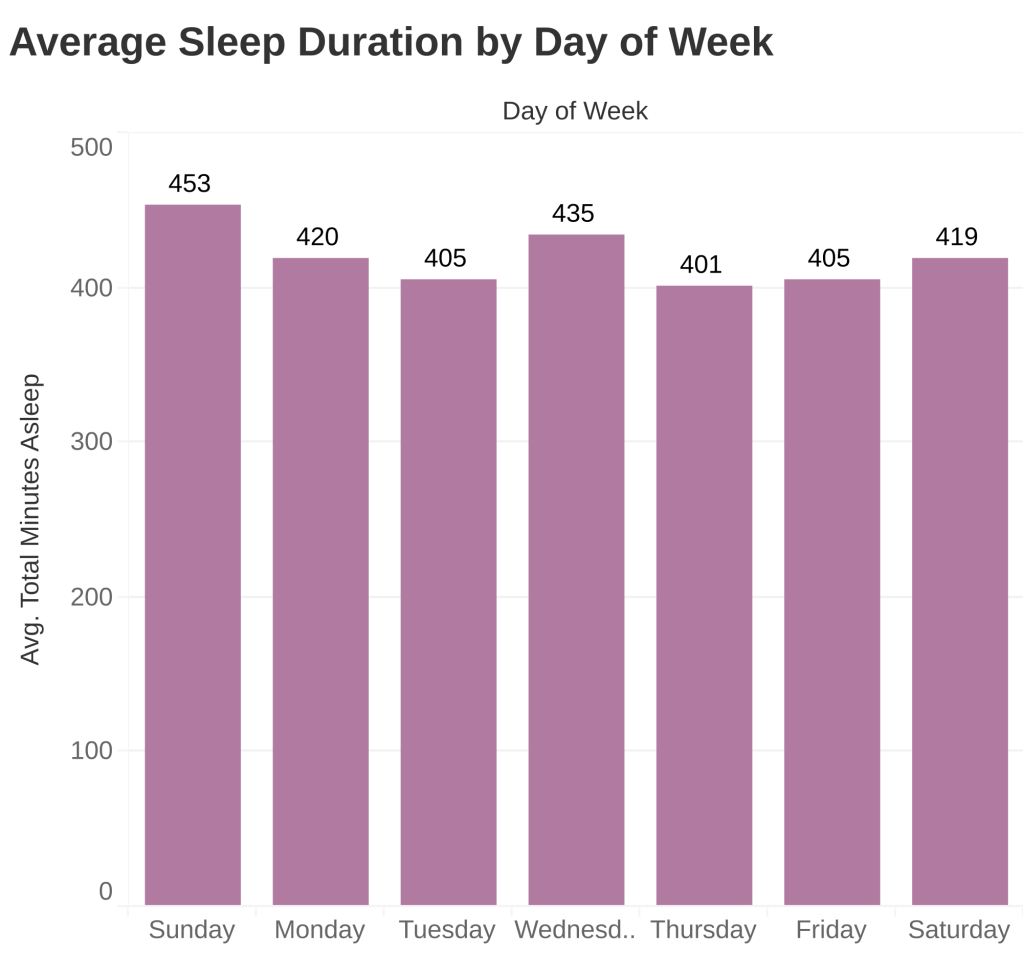
Participants averaged approximately 419 minutes, or just under seven hours, of sleep per recorded night. Average sleep duration varied across the week, ranging from 401 minutes on Thursday to 453 minutes on Sunday.
Sleep efficiency was considerably more consistent, remaining around 91–92% across most days. Sunday combined the longest average sleep duration with the lowest average efficiency at 90.5%.
The results suggest that the amount of sleep participants received varied more meaningfully across the week than the proportion of time in bed actually spent asleep.
The Initial Sleep-Activity Pattern Did Not Hold Up Under Further Testing
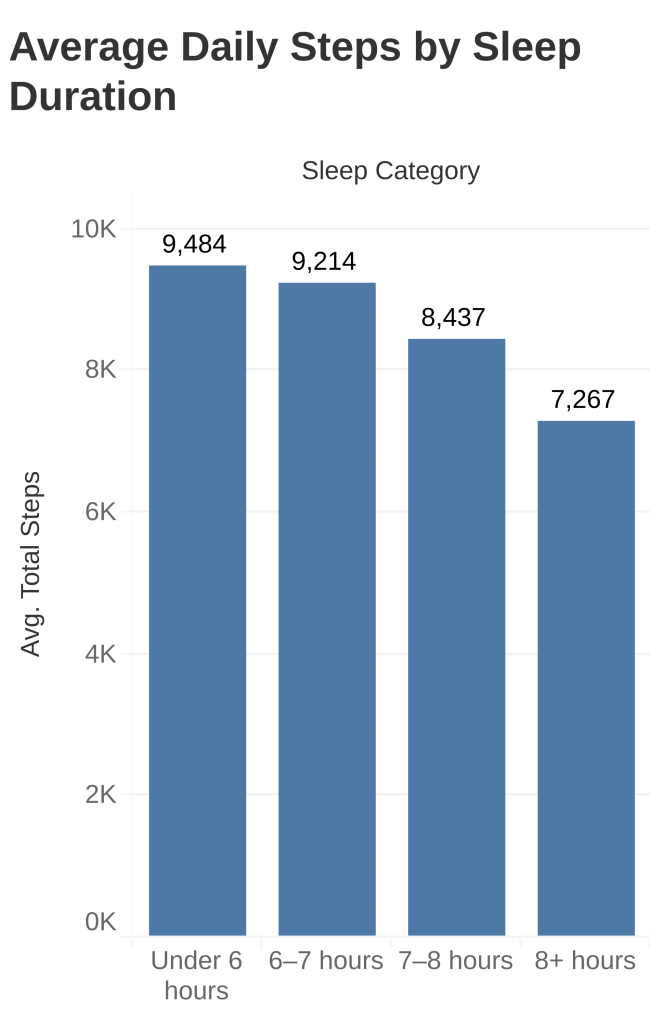
When I grouped daily observations by sleep duration, a clear pattern initially appeared. Participants averaged 9,484 steps on days associated with fewer than six hours of sleep, compared with 7,267 steps in the eight-or-more-hours category. The intermediate sleep categories also generally followed this downward pattern.
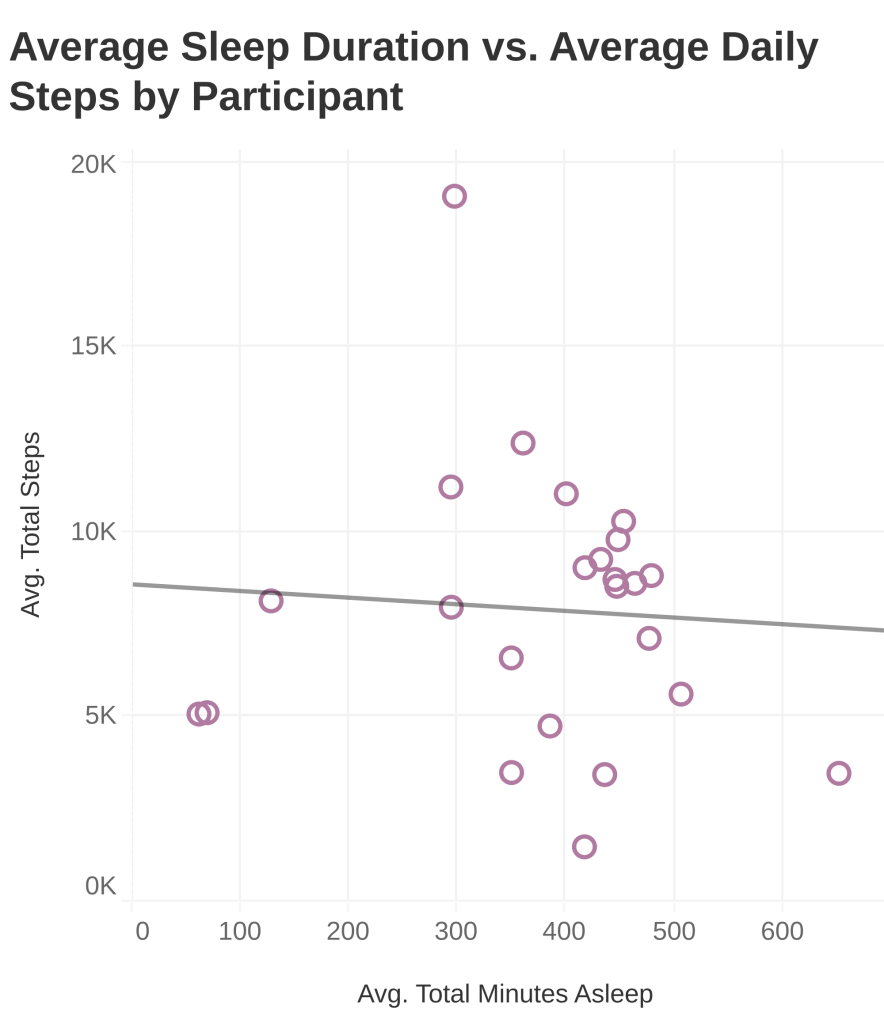
Rather than treating this as evidence that less sleep leads to greater activity, I tested the relationship at the participant level. For each of the 24 participants with matched sleep and activity data, I compared their average sleep duration with their average daily steps.
The resulting linear relationship was negligible, with an R² of 0.0044. In other words, differences in participants’ average sleep duration explained virtually none of the variation in their average activity levels.
This was an important check on the initial result. The sleep-category pattern is present in the pooled daily observations, but the data does not support a broader conclusion that people who sleep less are generally more active.
Recommendations
Based on the analysis, Bellabeat could focus on encouraging consistent, achievable activity rather than emphasizing high-intensity exercise alone. Participants spent considerably more time in light activity than in moderate or vigorous activity, suggesting an opportunity to position everyday movement as an accessible part of wellness.
Bellabeat could also test targeted reminders or challenges on lower-activity days such as Sunday, while recognizing that weekday differences in this sample were relatively modest.
Sleep messaging should be approached more cautiously. Although sleep duration varied throughout the week, this dataset did not show a meaningful participant-level relationship between sleep duration and physical activity. Bellabeat should avoid implying that the two behaviors are directly connected based on these results alone.
More broadly, combining activity and sleep tracking could still help Bellabeat provide users with a more complete picture of their routines, while personalized recommendations should rely on individual trends rather than assumptions drawn from aggregate behavior.
Tableau Dashboard
I created an interactive Tableau Public dashboard to bring the primary findings together in a single view. It includes weekday activity and sleep patterns, activity intensity, sleep-duration groups, and the participant-level comparison between sleep and daily steps.
Interactive Dashboard: View the interactive Tableau dashboard
The dashboard was built from the same cleaned and joined dataset used throughout the analysis.
Tools
Google Sheets: Data cleaning, validation, joins, pivot tables, exploratory analysis, and initial visualizations
Tableau Public: Final visualizations, trend analysis, and interactive dashboard

