
DFW’s Growing Water Demand
Growth, climate, development, and municipal water demand across Dallas-Fort Worth, 2016–2024
Project Overview
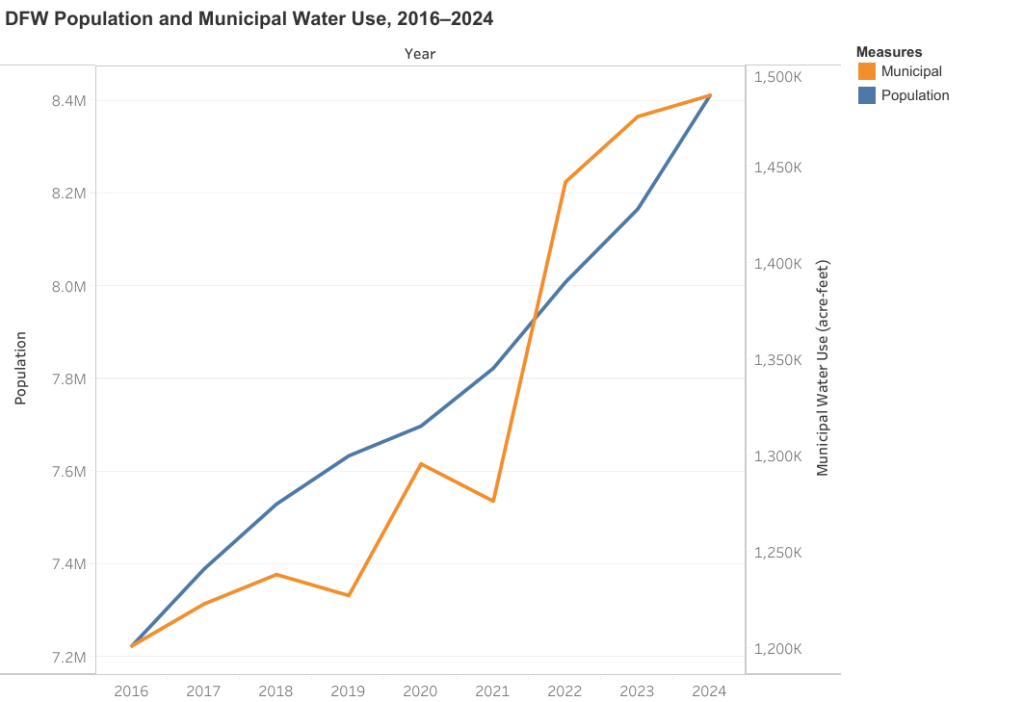
Dallas-Fort Worth added nearly 1.2 million people between 2016 and 2024. Over the same period, municipal water use increased even faster.
This analysis combines nine years of water-use, population, climate, drought, reservoir, and development data across 12 DFW counties to examine what was driving that increase and whether population growth alone explains it.
Regional population increased 16.5%, while municipal water use increased 23.8%. Per-capita consumption ended the period 6.3% higher. The largest disruption occurred in 2022, when per-capita water use increased 10.4% as severe drought expanded across the region.
Growth was also uneven. Kaufman, Rockwall, Ellis, and Denton experienced particularly large increases in municipal demand. Collin County moved differently: its population grew 33.5%, but municipal water use increased 22.5% and per-capita use declined 8.3%.
The Question
Population is only one source of pressure on municipal water systems. Housing construction adds new connections. Residential and commercial consumption can change independently of population. Hot and dry conditions can increase demand while drought can simultaneously place pressure on available supplies.
I wanted to examine these factors together rather than treat regional water use as a simple population-growth problem.
The analysis focused on five questions:
- How quickly did municipal demand grow relative to population?
- Which counties experienced the greatest changes in demand?
- How did drought, temperature, and precipitation correspond with consumption?
- How did residential and commercial water use change?
- How did housing development and new connections track regional growth?
Scope and Data
I defined the study area as 12 counties: Collin, Dallas, Denton, Ellis, Hood, Hunt, Johnson, Kaufman, Parker, Rockwall, Tarrant, and Wise.
The study covers 2016 through 2024.
The Texas Water Development Board (TWDB) provided the primary water-use data. Its historical county reports supplied annual municipal water use and population, while its public-water-system categorical data supplied residential and commercial volumes and connection counts. TWDB states that its historical estimates use annual Water Use Survey information and other water-use estimates, and that reports for 2000 and later can be refreshed when corrected information becomes available.
Additional data came from NOAA/NCEI, the U.S. Drought Monitor, the U.S. Census Bureau, and TWDB’s Water Data for Texas reservoir database.
Preparing the Data
I used Python and pandas to clean, combine, validate, and aggregate the source files before visualization in Tableau.
Nine annual TWDB county files were combined and filtered to the 12 study counties. Municipal gallons per capita per day (GPCD) was calculated as:
GPCD = Municipal acre-feet × 325,851 ÷ Population ÷ 365
Residential and commercial records presented a different problem. TWDB reports categorical consumption by public water system rather than directly by county. I created a geographic crosswalk using the Texas Water Service Boundary Viewer, normalized public-water-system identifiers, and matched the systems to the study counties.
The crosswalk identified 554 public water systems associated with the 12 counties. Across 2016–2024, 4,216 categorical records matched the study area.
NOAA daily weather observations were aggregated annually. Average daily temperature was calculated from daily maximum and minimum temperature, and precipitation was summed by year.
Weekly U.S. Drought Monitor county observations were also aggregated annually. I used D2, the percentage of area experiencing severe drought or worse, to construct a regional annual drought indicator.
Census population estimates were used as an independent check against the TWDB population series. Building Permit Survey records were aggregated across the 12 counties by year. Dallas and Fort Worth municipal reservoir data provided regional supply context.
The final analysis produced:
- Regional dataset: 9 rows × 48 fields
- County dataset: 108 rows × 12 fields
Demand Grew Faster Than Population
The study population increased from approximately 7.22 million in 2016 to 8.41 million in 2024, an increase of 16.5%.
Municipal water use increased 23.8%.
Regional GPCD increased from 148.4 to 157.9 gallons per person per day, a net increase of 6.3%.
The increase was not steady. GPCD declined through 2019 before rising during the early 2020s.
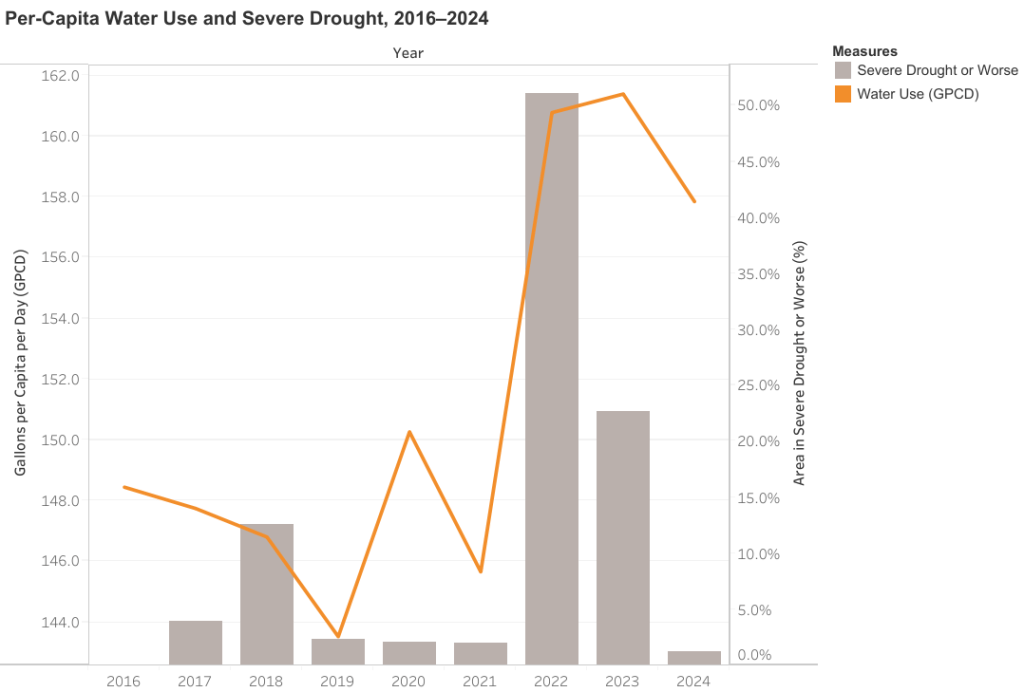
The largest change occurred in 2022. Population increased 2.4%, while:
- GPCD increased 10.4%
- Residential volume increased 16.7%
- Commercial volume increased 15.7%
Every study county recorded higher GPCD that year. Parker increased approximately 22.6%, Hood 21.0%, Denton 13.1%, Tarrant 11.0%, and Dallas 10.6%.
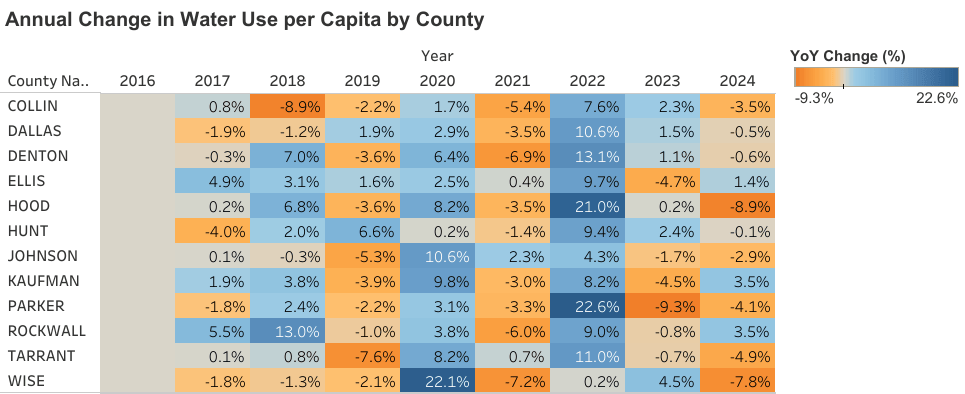
County-level changes were mixed in 2023 and predominantly negative in 2024, even as population continued to grow. The pattern makes 2022 stand out as a regional demand shock rather than a continuation of a smooth long-term trend.
Climate and Demand
Climate provides important context for the 2022 increase.
The average share of the region experiencing severe drought or worse reached 51.1% in 2022, compared with 2.0% in 2021. GPCD simultaneously rose from 145.7 to 160.8.
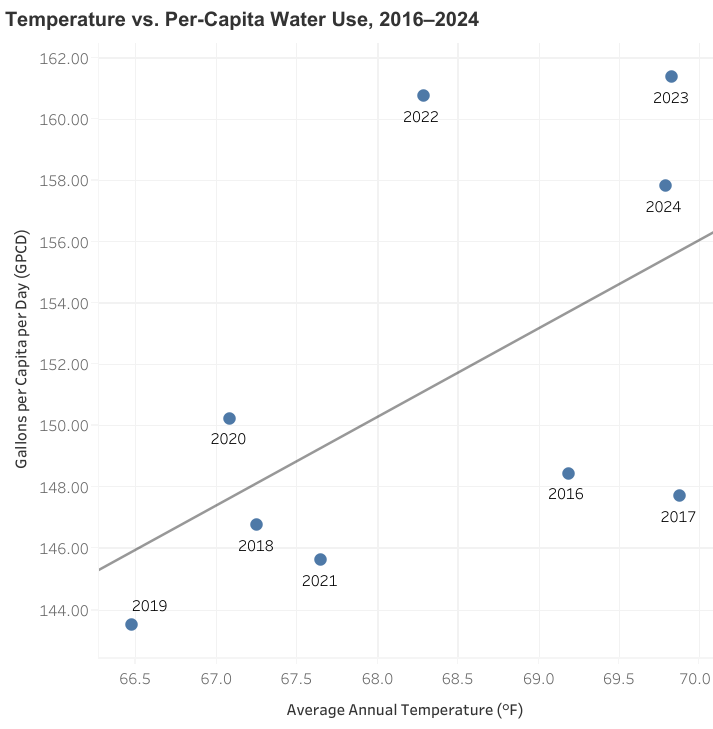
Temperature also had a moderate positive relationship with GPCD across the nine annual observations. The correlation was approximately +0.56, while the Tableau linear trend produced an R² of 0.318.
Precipitation had a weaker negative correlation with GPCD of approximately -0.26. The wettest year was 2018 at approximately 56.0 inches. The driest was 2023 at approximately 29.3 inches.
These relationships are descriptive, not causal. Nine annual observations are not sufficient to isolate the effect of temperature, precipitation, or drought from other factors affecting consumption.
Supply Pressure
Reservoir conditions add another dimension to 2022.
Dallas and Fort Worth reservoir systems remained relatively high through the earlier years of the study, then declined substantially in 2022 as regional consumption increased.
Dallas reservoir storage averaged approximately 89.3% in 2022, while Fort Worth averaged approximately 85.4%.
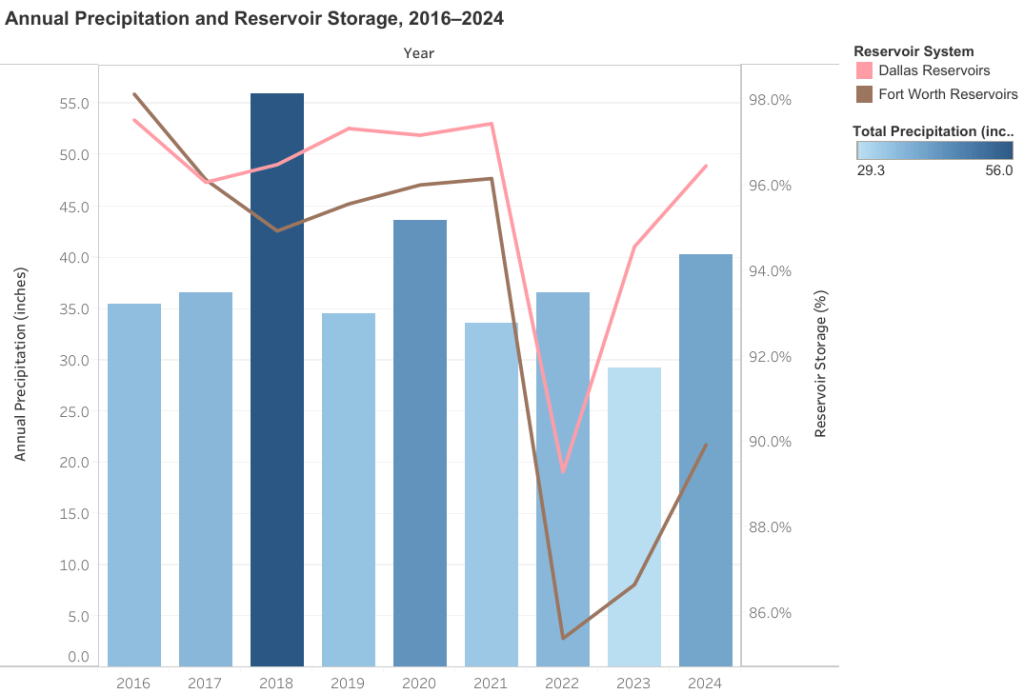
By 2024, Dallas had recovered to approximately 96.5%, while Fort Worth remained lower at approximately 89.9%.
The 2022 data illustrate the potential for demand pressure and deteriorating supply conditions to occur simultaneously.
Growth Was Uneven
Regional totals obscure major county differences.
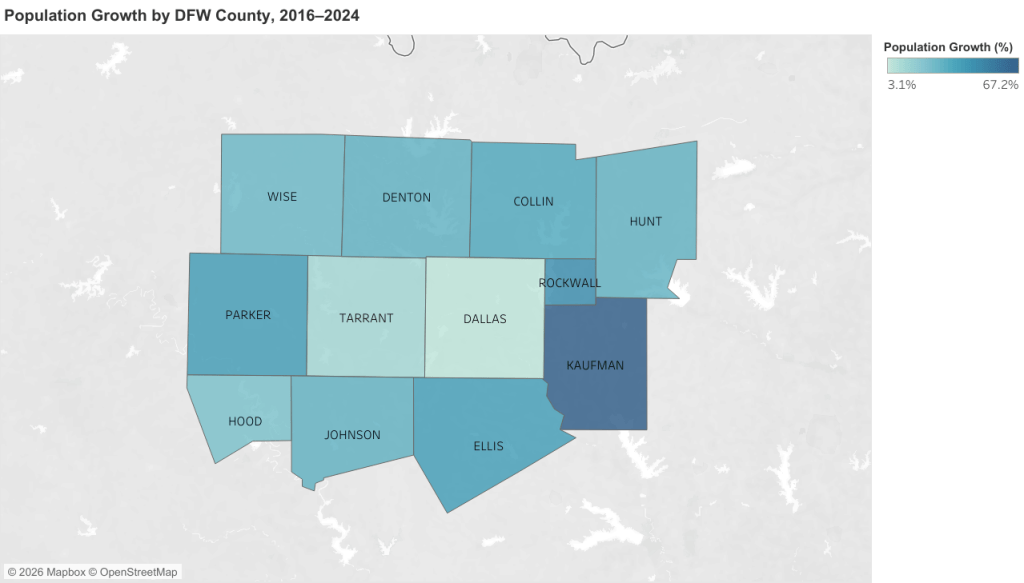
Kaufman had the fastest population growth at 67.2%, followed by Rockwall at 45.8%, Parker at 38.8%, Ellis at 37.9%, and Collin at 33.5%.
Water demand followed a different ranking.
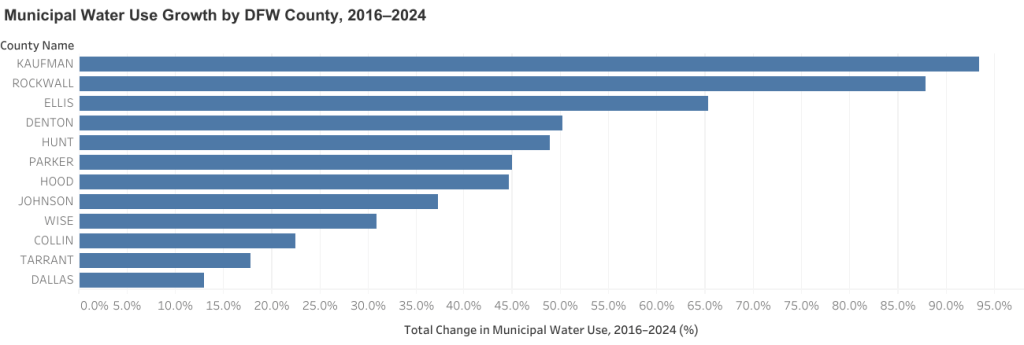
Kaufman’s municipal water use increased 93.4%. Rockwall increased 87.9%, Ellis 65.3%, and Denton 50.2%.
The relationship becomes clearer when population and municipal-water growth are compared directly.
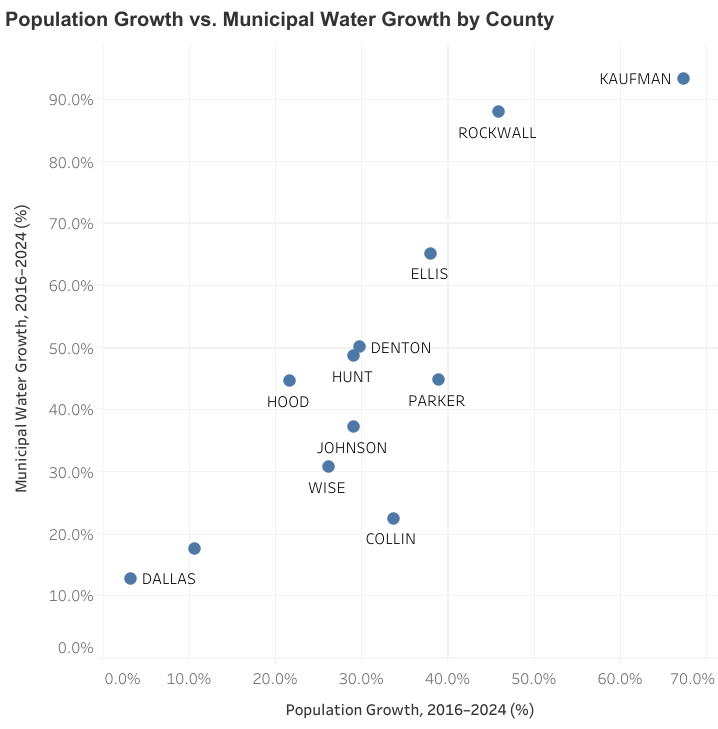
Kaufman and Rockwall experienced water-demand growth substantially above their already rapid population growth.
Collin was a notable counterexample. Its population increased 33.5%, while municipal water use increased 22.5% and GPCD declined 8.3%.
Population growth alone therefore does not explain the county-level differences. Development patterns, conservation, customer composition, infrastructure, pricing, and other local factors may also matter, although this analysis does not isolate their individual effects.
Residential and Commercial Use
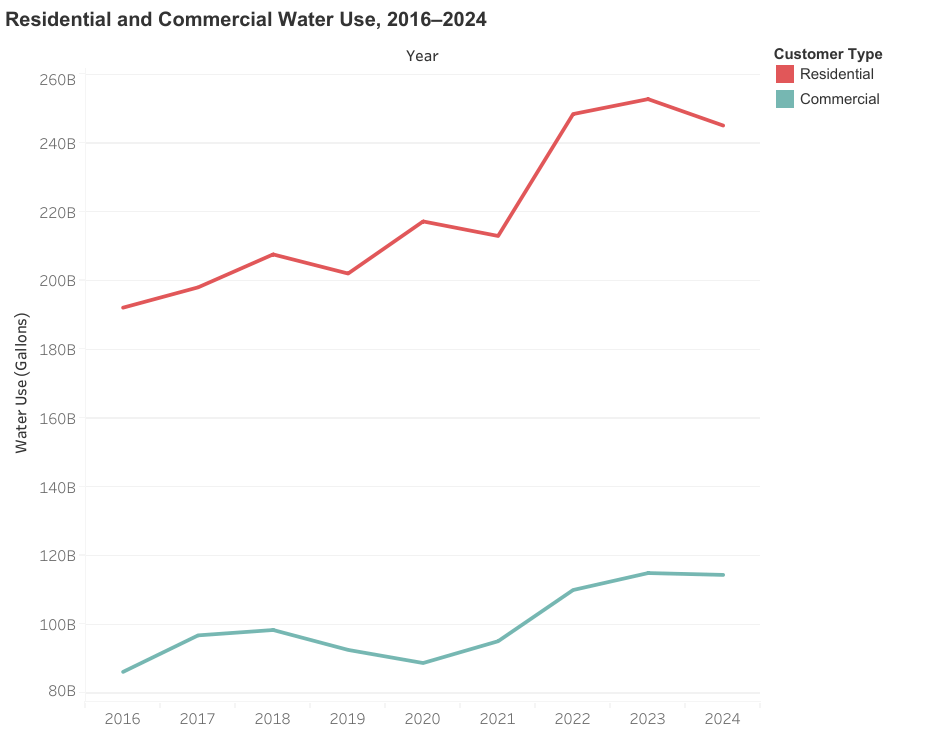
Residential water volume increased from approximately 192.3 billion gallons in 2016 to 245.3 billion in 2024, an increase of 27.6%.
Commercial volume increased from approximately 86.2 billion to 114.4 billion gallons, an increase of 32.8%.
Residential connections increased from approximately 2.12 million to 2.79 million. Commercial connections increased from approximately 174,700 to 205,400.
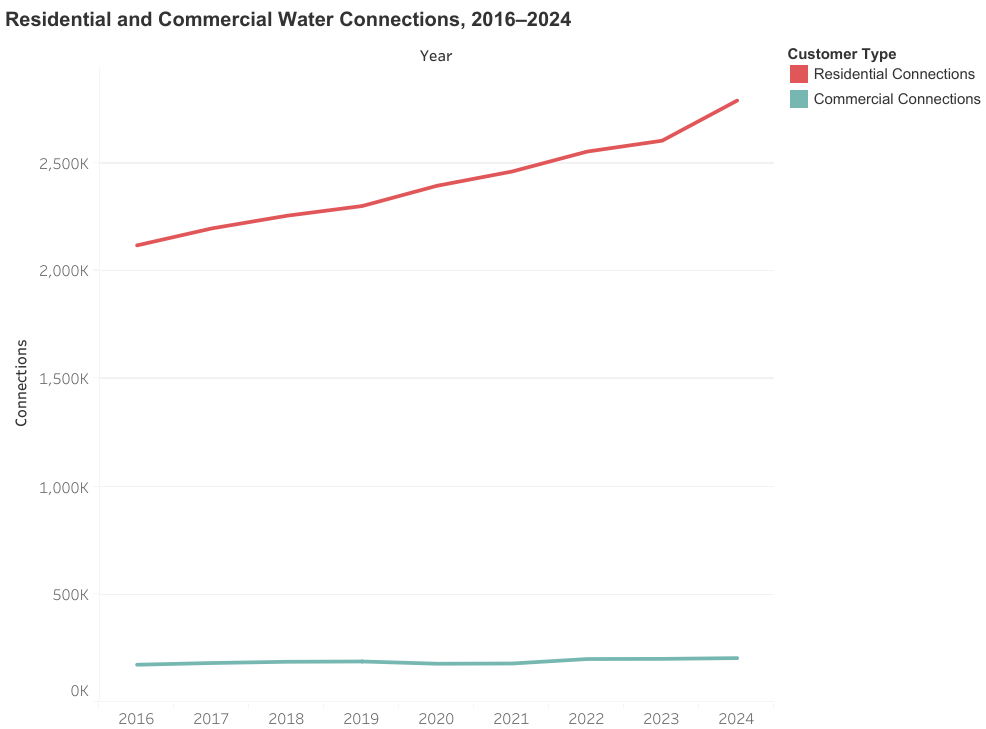
The 2020–2022 period stands out. Commercial connections declined 5.5% in 2020 and commercial volume declined 4.1%. By 2022, commercial connections increased 11.5% year over year and commercial volume increased 15.7%.
That pattern is consistent with a rebound in commercial activity, but the water-use data alone cannot establish its cause.
Development and Demand
Housing development remained substantial throughout the study.
The 12 counties permitted approximately 55,769 housing units in 2016 and 71,929 in 2024. The highest annual total occurred in 2021 at approximately 78,996 units.
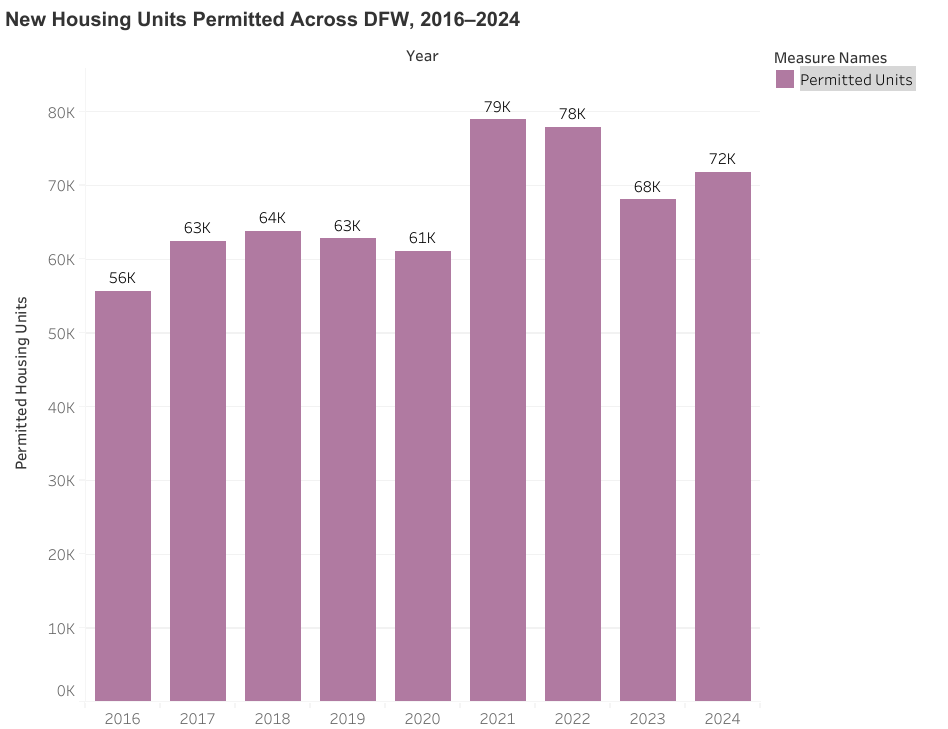
Population continued increasing even after permitting declined from its 2021 peak.
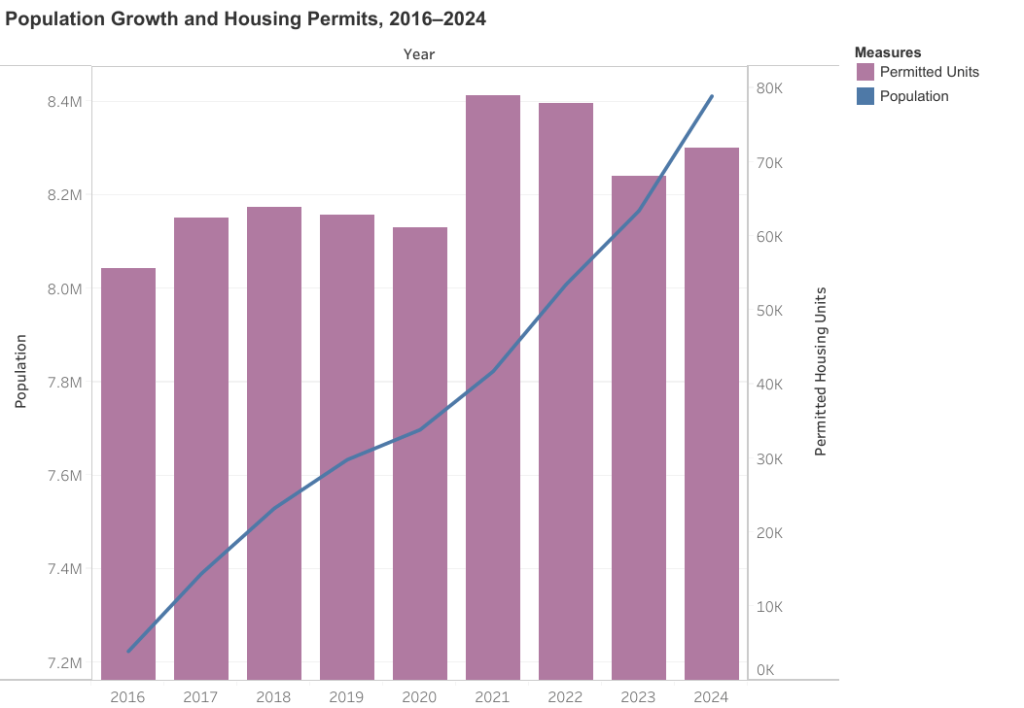
Building permits represent authorized units, not completed or occupied homes. The 29.0% difference between the 2016 and 2024 annual totals should also not be interpreted as cumulative development.
Still, the simultaneous growth of population, permitting activity, and residential water connections demonstrates the continuing expansion of the region’s municipal customer base.
Key Findings
Municipal demand outpaced population growth. Population increased 16.5% from 2016 to 2024, while municipal water use increased 23.8%.
2022 was the major demand shock. GPCD increased 10.4%, residential volume 16.7%, and commercial volume 15.7% as severe drought expanded across the region.
County trajectories differed sharply. Kaufman and Rockwall experienced exceptionally high water-demand growth, while Collin combined rapid population growth with declining per-capita consumption.
Residential and commercial consumption both grew faster than population. Residential volume increased 27.6% and commercial volume 32.8%.
Demand and supply pressure coincided in 2022. Consumption rose while Dallas and Fort Worth reservoir conditions deteriorated.
Limitations
This analysis is observational and does not establish causation.
The climate analysis contains only nine annual observations, making correlations sensitive to individual years.
The 12-county study area is an analytical definition of DFW, not a claim that it is the only official metropolitan definition.
TWDB water-use figures are based on surveys and estimates and may be revised. TWDB notes that its historical reports are periodically refreshed with corrected information.
Residential and commercial data required matching public water systems to counties using service-area data. The resulting geography is therefore an analytical crosswalk rather than a direct county field in the categorical source.
The NOAA series uses a single DFW Airport station as a regional weather indicator. Conditions vary across the 12-county area.
Annual drought values summarize weekly observations and therefore obscure within-year variation.
Building permits measure authorized construction, not completed or occupied housing.
Dallas and Fort Worth reservoir aggregates provide supply context but do not represent every water source serving the 12 counties.
Other potentially important factors, including conservation programs, water pricing, land use, infrastructure, and customer composition, were not modeled directly.
Tools
Python/pandas: cleaning, transformation, joining, validation, aggregation, calculations, and correlation analysis
Tableau Public: visualization and dashboard development
Excel/Google Sheets: source inspection and validation
Conclusion
DFW’s water story from 2016 through 2024 was not simply a matter of more people requiring proportionally more water.
Population increased rapidly, but municipal demand increased faster. Residential and commercial consumption expanded, counties followed markedly different trajectories, and the region experienced a pronounced demand surge during severe drought in 2022.
Collin County also demonstrated that rapid population growth can occur alongside declining per-capita consumption.
DFW’s continued growth will create additional demand, but population alone does not determine how much pressure that growth places on water supplies. Consumption patterns, development, climate, conservation, and local conditions also shape the outcome.
References
Texas Water Development Board. Historical Water Use Estimates by County, 2000 and Later (Includes Reuse), Report 7.
Primary source for annual county population and municipal water-use estimates used in the analysis.
TWDB Historical Water Use Estimates
Texas Water Development Board. Historical Categorical Connections and Volumes by Public Water System, 2016 and Later, Report 18.
Source for residential and commercial water volumes and connection counts.
TWDB SARA Database Reports
Texas Water Development Board. Texas Water Service Boundary Viewer.
Source used to associate public water systems with the 12 study counties for the categorical water-use analysis.
Texas Water Service Boundary Viewer
Texas Water Development Board, Water Data for Texas. Dallas Area Reservoirs.
Historical municipal-area reservoir storage data used for the Dallas reservoir series.
Dallas Area Reservoirs
Texas Water Development Board, Water Data for Texas. Fort Worth Area Reservoirs.
Historical municipal-area reservoir storage data used for the Fort Worth reservoir series.
Fort Worth Area Reservoirs
National Oceanic and Atmospheric Administration, National Centers for Environmental Information. Climate Data Online, Daily Summaries.
Daily temperature and precipitation observations from the DFW Airport station used to construct annual climate measures.
NOAA Climate Data Online
U.S. Drought Monitor. Comprehensive Statistics Data Download.
Weekly county-level drought statistics used to construct the annual severe-drought indicator.
The U.S. Drought Monitor is produced through a partnership involving the National Drought Mitigation Center, USDA, NOAA, and NASA.
U.S. Drought Monitor Data Download
U.S. Census Bureau. County Population Estimates.
Intercensal 2010–2020 estimates and 2020s county population estimates were used to independently validate the TWDB population series.
2010–2020 County Intercensal Population Estimates
2020–2025 County Population Estimates
U.S. Census Bureau. Building Permits Survey.
Annual county-level permits for privately owned residential construction used as the study’s housing-development measure.
Building Permits Survey

