
SBA 7(a) Lending
Industry Resilience and Lending Change, 2000–2025
Project Overview
This project analyzes more than 1.5 million SBA 7(a) loan records to examine how small-business lending changed across industries, regions, economic periods, and credit environments from FY2000 through FY2025.
I began with a question about resilience: which types of small businesses historically demonstrated the strongest repayment outcomes across changing economic conditions? I then examined whether historically resilient industries continued to receive a comparable share of SBA lending, how the geographic distribution of lending changed, and how loan size and volume evolved over time.
Because recent loans have not had enough time to produce repayment outcomes comparable with older cohorts, I separated mature historical performance from recent lending trends rather than treating all 25 years as a single outcome dataset.
Tools: Python, pandas, statsmodels, Tableau
Data sources: U.S. Small Business Administration, Bureau of Labor Statistics, Federal Reserve, U.S. Census Bureau
Questions
The analysis focused on five questions:
- Which industries demonstrated the strongest historical repayment resilience in SBA 7(a) lending?
- Do industries with stronger historical repayment outcomes receive a larger or smaller share of SBA lending relative to their presence in the broader economy?
- How has the geographic distribution of SBA lending changed, and how much of that change can be explained by population shifts?
- How have loan volume, real loan size, industry composition, and the credit environment changed since 2000?
- What do historical lending patterns suggest about how small-business lending may respond to future economic shifts?
I also examined FY2021 separately after the initial analysis revealed an unusually large increase in approved capital and loan size.
Data and Methodology
The core dataset comes from the SBA’s public 7(a) FOIA files. After combining the FY2000–2009, FY2010–2019, and FY2020–Present files and removing incomplete FY2026 observations, the analysis contained 1,583,598 loan records.
I standardized NAICS industries, mapped project states to Bureau of Economic Analysis regions, processed loan outcomes and dates, and converted monetary values to 2025 dollars using BLS CPI-U data.
The most important methodological issue was outcome maturity. Recent loans have had much less opportunity to be paid in full or charged off than older loans. Among loans that eventually charged off, approximately 95% did so within ten years of approval. I therefore limited the primary repayment analysis to FY2001–2015 originations with at least ten years of outcome observation.
FY2000 was excluded from industry-specific outcome analysis because approximately 45% of its records were missing NAICS codes.
The resulting mature cohort contained 823,508 completed loans: 666,297 paid in full and 157,211 charged off.
For broader comparisons, I divided the study into three periods:
- FY2001–2015: mature repayment outcomes
- FY2016–2019: intermediate/pre-COVID lending composition
- FY2020–2025: recent lending trends
I supplemented the SBA data with BLS Quarterly Census of Employment and Wages data to compare industry lending shares with private-sector establishment shares, Census population estimates to evaluate regional lending shifts, and the Bank Prime Loan Rate to provide broader credit-market context.
I also estimated a logistic regression for the mature cohort to test whether industry differences persisted after controlling for region, approval year, loan-size quartile, business type, and lender group.
Industry Resilience
Repayment outcomes varied substantially across industries, but they also changed sharply depending on when loans were originated.
Among major industries, Health Care had a mature charge-off rate of approximately 11.0%. Professional/Technical Services and Manufacturing were also comparatively strong at 16.5% and 16.6%, respectively. Retail Trade and Real Estate were among the highest at 22.4% and 23.0%.
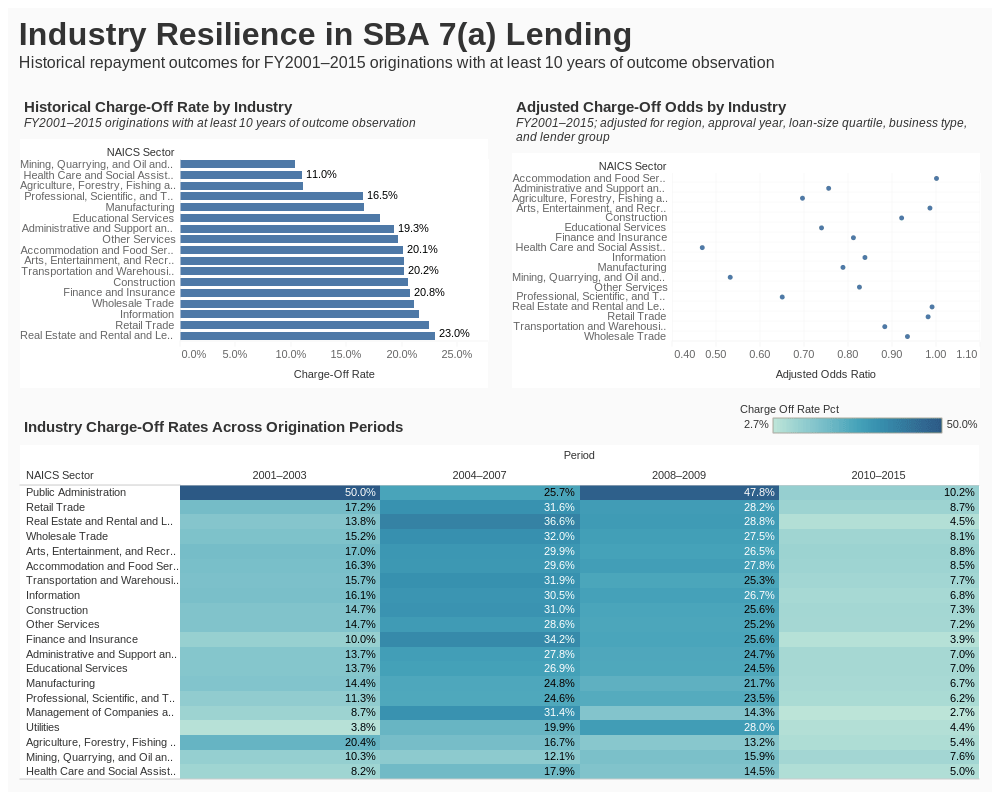
The period analysis revealed an important complication: industry averages can conceal major differences between origination cohorts. Real Estate loans originated during FY2004–2007 had a 36.6% eventual charge-off rate, compared with 4.5% among FY2010–2015 originations. Similar period effects appeared throughout much of the portfolio.
Health Care showed the clearest large-sector historical resilience. Its adjusted charge-off odds were approximately 53% lower than Accommodation/Food, the model’s reference industry, after controlling for region, approval year, loan-size quartile, business type, and lender group.
Professional/Technical Services also maintained substantially lower adjusted odds, while Manufacturing remained comparatively strong.
The results suggest that industry was meaningfully associated with repayment performance, but the period in which a loan originated was also an important part of the story.
Resilience and Lending Representation
Historical repayment resilience did not consistently correspond with a larger subsequent share of SBA lending.
To examine this, I compared each industry’s share of SBA loans with its share of U.S. private-sector establishments using QCEW data.
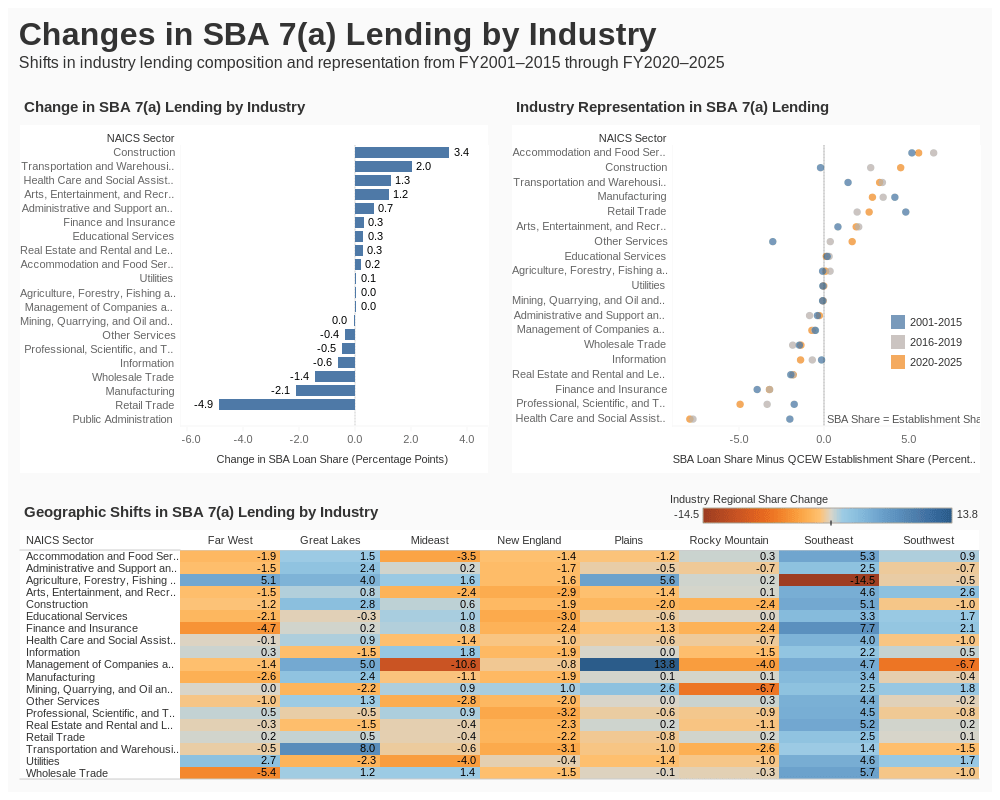
Health Care was a notable example. Despite comparatively strong historical repayment outcomes, its share of SBA lending became increasingly low relative to its establishment footprint. Professional/Technical Services showed a similar pattern.
Construction moved in the opposite direction. Its share of SBA lending increased substantially, and its loan share became increasingly large relative to its share of private-sector establishments.
Between FY2001–2015 and FY2020–2025, Construction’s loan-versus-establishment gap increased by approximately 4.7 percentage points, while Health Care’s declined by approximately 5.9 points and Professional/Technical Services’ declined by approximately 3.2 points.
These differences do not indicate that SBA lending should be reallocated. Establishment share does not measure credit demand, eligibility, conventional financing availability, or optimal lending levels. Instead, the comparison shows that historical repayment performance and subsequent lending representation have not moved together consistently.
Changing Industry Mix
The composition of 7(a) lending also changed over the study period.
Construction increased from approximately 9.4% of loans in FY2001–2015 to 12.7% in FY2020–2025. Health Care increased from approximately 8.2% to 9.5%.
Retail Trade moved in the opposite direction, declining from approximately 17.2% to 12.3%. Manufacturing declined from approximately 8.4% to 6.3%.
These changes were not confined to a single part of the country. Retail lost lending share across numerous regions while Construction gained share across numerous regions.
The Southeast experienced particularly broad growth across industries, including Construction, Finance, Wholesale Trade, Accommodation/Food, Real Estate, Professional/Technical Services, and Health Care. The Great Lakes shift was more concentrated in areas such as Transportation/Warehousing and Construction.
This suggests that changes in industry composition and geography were interconnected rather than independent trends.
Regional Lending Shifts
Population growth alone did not explain changes in the geographic distribution of SBA lending.
The Southeast’s share of SBA loans increased from approximately 16.6% in FY2001–2015 to 20.5% in FY2020–2025. Its average share of the U.S. population increased much less, from approximately 25.2% to 26.1%.
The Southeast therefore remained underrepresented by loan count relative to population, but the gap narrowed substantially.
The Great Lakes showed a different pattern. Its population share declined while its SBA loan share increased, moving from approximately proportional representation in FY2001–2015 to a loan share about 3.1 percentage points above its population share in FY2020–2025.
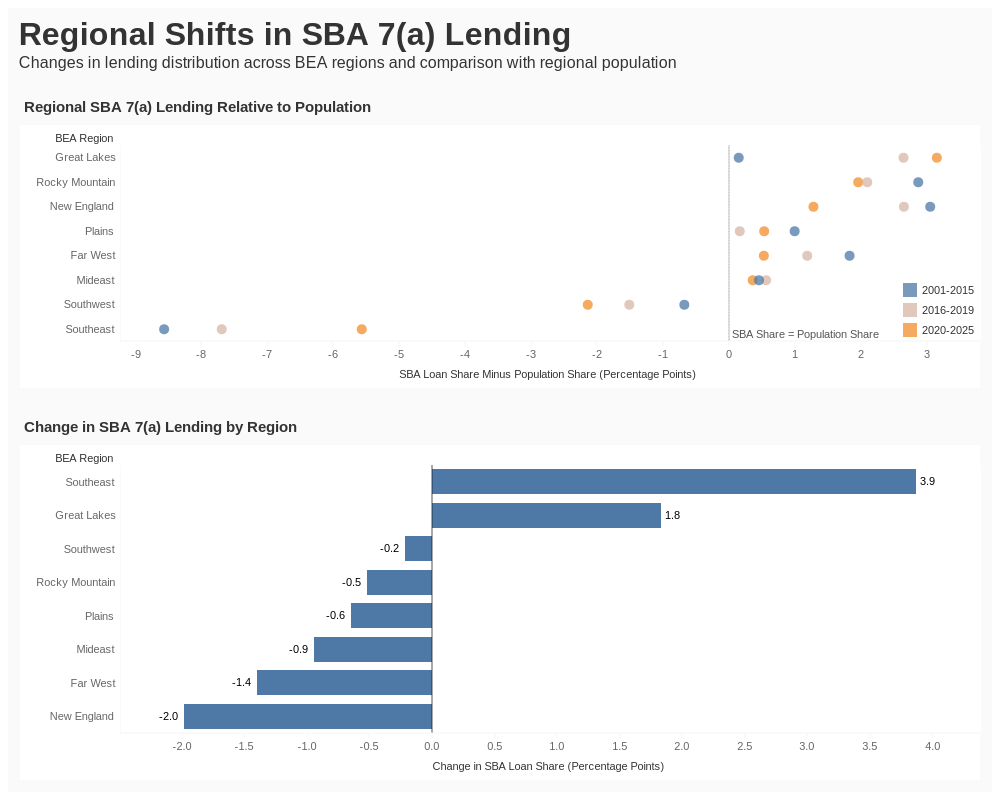
Loan counts and approved dollars also produced different geographic pictures. The Far West was close to proportional representation by recent loan count but accounted for a noticeably larger share of approved dollars than population. The Southwest had a lower loan-count share than population but a higher dollar share.
These differences reinforce the importance of treating loan volume and capital volume as separate measures.
Lending Over Time
The 25-year history of 7(a) lending shows several distinct phases.
During FY2003–2007, loan approvals increased rapidly, reaching nearly 100,000 in FY2007. At the same time, the inflation-adjusted median loan fell from approximately $112,000 in FY2003 to $78,000 in FY2007. The expansion therefore involved many more approvals but progressively smaller typical loans.
The Great Recession brought a sharp contraction. Approvals fell from approximately 99,600 in FY2007 to 41,300 in FY2009, while inflation-adjusted approved dollars declined from approximately $22.2 billion to $13.8 billion.
Lending recovered during the first half of the 2010s. This recovery occurred alongside significant changes to the 7(a) program. The American Recovery and Reinvestment Act temporarily increased the maximum SBA guaranty on eligible 7(a) loans to 90% and reduced certain borrower and lender fees. The Small Business Jobs Act of 2010 subsequently increased the maximum standard 7(a) loan amount from $2 million to $5 million.
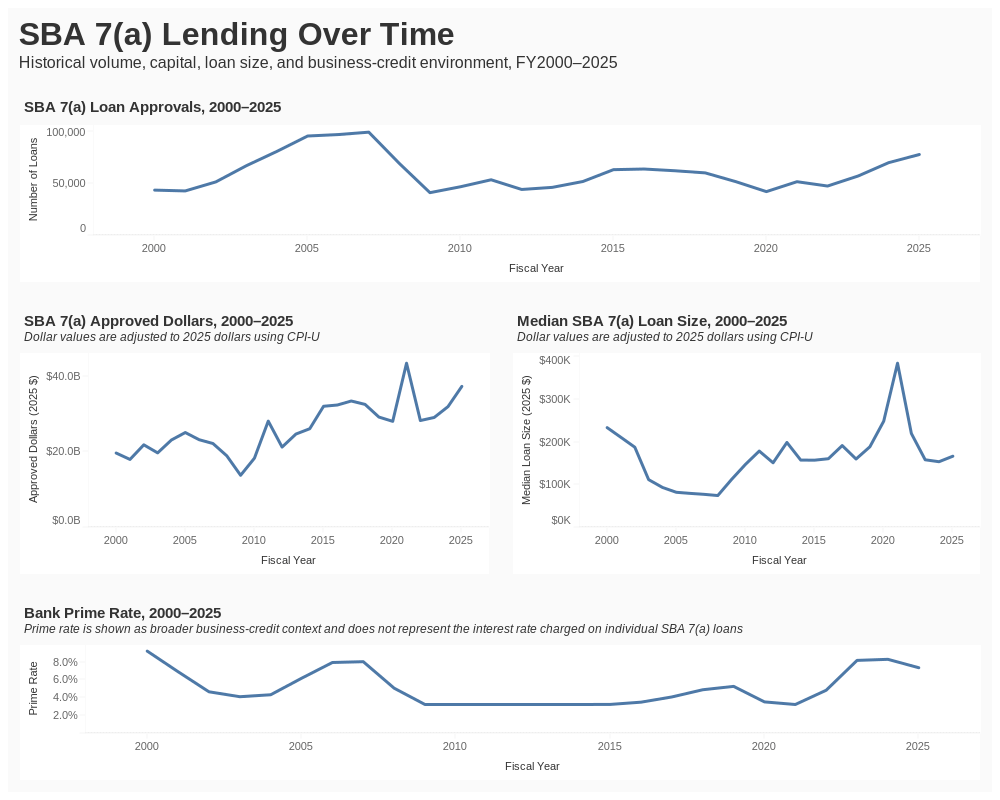
By FY2015, the program approved approximately 63,500 loans representing $32.0 billion in 2025 dollars. These policy changes provide important context for the recovery, although the descriptive analysis does not attempt to isolate their effects from the broader economic recovery or other changes in credit demand and supply.
Activity then weakened before COVID. Loan counts declined from approximately 64,100 in FY2016 to 51,900 in FY2019, showing that the decline in approvals preceded the pandemic.
FY2021 stood out after the pandemic disruption. Inflation-adjusted approved capital reached approximately $43.4 billion, the highest annual amount in the FY2000–2025 dataset, before falling sharply in FY2022.
By FY2025, approvals had recovered to approximately 78,100 loans and $37.3 billion in 2025 dollars despite a substantially higher prime-rate environment than prevailed during much of the 2010s.
Across the full period, loan count, total capital, and median loan size frequently moved in different directions. No single measure adequately describes changes in 7(a) lending activity.
The FY2021 Loan-Size Shift
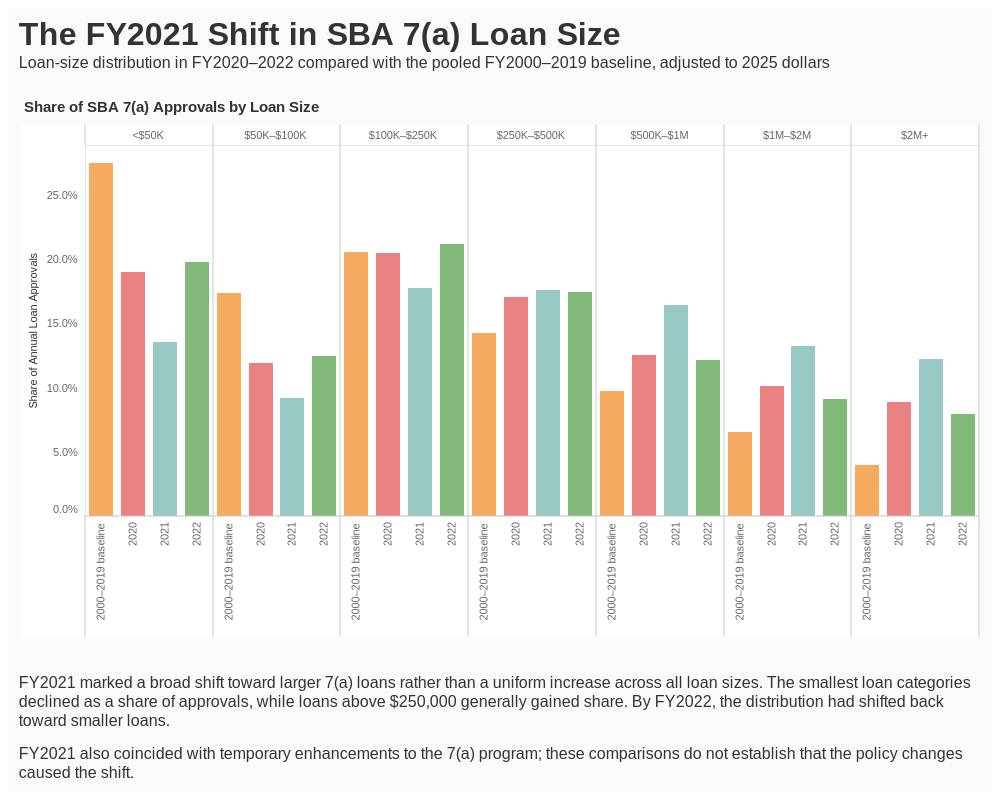
FY2021’s increase in approved capital was much larger than its increase in loan count, so I examined the distribution of inflation-adjusted loan sizes separately.
Compared with both the pooled FY2000–2019 baseline and the surrounding years, FY2021 showed a broad shift toward larger loans.
The smallest loan category, below $50,000, declined sharply as a share of approvals. The $50,000–$100,000 category also declined, while the $100,000–$250,000 category changed comparatively little. Above that range, larger loans generally gained share.
Loans of at least $500,000 represented 31.6% of FY2020 approvals, 41.9% in FY2021, and 29.2% in FY2022.
Industry and regional dollar shares were comparatively stable across these years, suggesting that the FY2021 anomaly was characterized more by a change in loan size than by a dramatic shift toward particular industries or regions.
FY2021 also occurred during an unusual policy environment. The CARES Act provided debt relief to existing 7(a), 504, and Microloan borrowers, while small businesses simultaneously had access to other pandemic assistance programs. SBA’s Office of Inspector General later reported that 7(a) loan dollars and average loan size increased substantially in FY2021 while approval counts returned to roughly pre-pandemic levels. That independently mirrors the pattern found in this analysis.
The timing makes the pandemic-era program environment important context for interpreting FY2021, but it does not establish causation. This analysis does not attempt to separate the effects of relief policies, borrower demand, lender behavior, pandemic conditions, or other factors.
Additional Findings
A simple descriptive comparison initially suggested that larger loans had lower charge-off rates. That relationship largely disappeared after controlling for other characteristics.
In the primary regression, the largest within-year loan-size quartile had essentially the same adjusted charge-off odds as the smallest quartile. This suggests that the apparent advantage of larger loans was largely associated with differences in industry, geography, origination year, business type, lender, or other characteristics rather than loan size itself.
A separate FY2010–2015 sensitivity analysis found that higher initial interest-rate quartiles were associated with progressively higher charge-off odds. Because reliable interest-rate data were not consistently available in earlier years, I kept this analysis separate from the primary historical model.
Recent Program Context
The final years of the study also include changes to 7(a) lending rules that should be considered when interpreting future trends. In 2023, SBA expanded simplified underwriting options for loans of $500,000 or less and made other changes to eligibility, documentation, and loan processing. Additional policy changes took effect under SOP 50 10 8 in June 2025.
Because these changes occur near the end of the study period, there is not yet enough post-change data to evaluate their longer-term relationship with loan volume, loan size, industry mix, or repayment outcomes. They therefore become part of the baseline for the 2026–2030 monitoring framework rather than a basis for conclusions about performance.
Monitoring 2026–2030
Rather than using mature historical outcomes to predict future winners and losers, I used FY2025 to establish a baseline for continued monitoring.
Future updates can track whether Construction continues gaining lending share, whether Health Care and Professional/Technical Services remain underrepresented relative to their establishment footprints, and whether the Southeast continues moving toward its population share of SBA lending.
The same framework can monitor whether the cross-regional shift from Retail toward Construction persists, how lending responds to changes in the credit environment, and whether future program growth occurs through more approvals, larger loans, or both.
Repayment outcomes should be incorporated only as newer cohorts mature. Recent raw charge-off rates are not directly comparable with the ten-year historical outcome cohort.
Limitations
The primary limitation is outcome maturity. Recent loans have not had sufficient time to produce repayment outcomes comparable with older loans, so FY2016–2025 is used primarily for lending composition rather than definitive charge-off comparisons.
The analysis is observational and does not establish causal effects. Industry, geography, interest rates, loan structure, policy changes, borrower characteristics, and broader economic conditions can interact in ways that are not fully captured in the public SBA data.
QCEW establishment share provides a consistent measure of industry footprint but does not measure credit demand, SBA eligibility, financing need, or conventional credit availability. Population serves a similar role in the regional analysis but does not directly measure regional small-business activity.
Several SBA fields were also unsuitable for consistent longitudinal analysis. Business-age reporting changed over time, while other variables had substantial missing data or changed in structure across source files.
Conclusion
SBA 7(a) lending changed substantially between 2000 and 2025.
Historical repayment performance differed meaningfully by industry, with Health Care showing the clearest large-sector resilience. However, the economic period in which loans originated was also strongly associated with eventual outcomes.
Historical resilience and subsequent lending representation did not move together consistently. Health Care and Professional/Technical Services became increasingly underrepresented relative to their private-sector establishment footprints, while Construction became a substantially larger part of the SBA portfolio.
Geographic changes were also more complex than population growth alone. Southeast lending grew considerably faster than its population share, while Great Lakes lending gained share despite a declining share of U.S. population.
Finally, the longitudinal analysis showed that loan count, approved capital, and typical loan size can move in very different directions. FY2021 provided the clearest example, with exceptional capital volume driven primarily by a shift toward larger loans rather than an equally exceptional increase in approval count.
Taken together, the results show a changing lending portfolio shaped by industry composition, geography, loan scale, economic conditions, and program context rather than by any single measure of lending activity or repayment performance.
Tools
Python/pandas: cleaning, transformation, joining, validation, aggregation, calculations, and correlation analysis
Tableau Public: visualization and dashboard development
statsmodels: logistic regression modeling, adjusted odds-ratio estimation, and statistical significance testing
References
U.S. Small Business Administration. 7(a) & 504 FOIA.
Primary source for loan-level SBA 7(a) records and the accompanying data dictionary used throughout the analysis. The study uses the FY2000–2009, FY2010–2019, and FY2020–Present 7(a) files.
https://data.sba.gov/dataset/7a-504-foia
U.S. Bureau of Labor Statistics. Quarterly Census of Employment and Wages (QCEW).
Source for national private-sector establishment and employment data by NAICS industry used to compare SBA lending composition with the broader economy.
https://www.bls.gov/cew/
U.S. Bureau of Labor Statistics. Employment and Wages, Annual Averages.
Annual QCEW data covering 2001 forward used to construct the historical industry comparison series.
https://www.bls.gov/cew/publications/employment-and-wages-annual-averages/
U.S. Bureau of Labor Statistics. Consumer Price Index.
CPI-U, U.S. city average, All Items was used to convert historical loan amounts and realized charge-off amounts to 2025 dollars.
https://www.bls.gov/cpi/
Board of Governors of the Federal Reserve System, via Federal Reserve Bank of St. Louis. Bank Prime Loan Rate (DPRIME).
Source for the prime-rate series used as broader business-credit context in the longitudinal analysis.
https://fred.stlouisfed.org/series/DPRIME
U.S. Census Bureau. State Population Totals and Components of Change: 2020–2025.
Vintage 2025 state resident population estimates used for the recent portion of the regional population series.
https://www.census.gov/data/datasets/time-series/demo/popest/2020s-state-total.html
U.S. Census Bureau. Population and Housing Unit Estimates.
Historical state population estimates used to construct the longer FY2000–2025 regional population series.
https://www.census.gov/programs-surveys/popest/data/data-sets.html
U.S. Bureau of Economic Analysis. BEA Regions.
Regional definitions used to group states and the District of Columbia into New England, Mideast, Great Lakes, Plains, Southeast, Southwest, Rocky Mountain, and Far West regions.
https://www.bea.gov/news/stgdppipce-release-additional-information
U.S. Small Business Administration. Statement from Administrator Mills on Urging Continued Support for Small Businesses’ Recovery Loan Programs.
Used to provide context for the post-recession recovery in SBA lending. The SBA documents that the American Recovery and Reinvestment Act provided funding to increase the 7(a) guaranty to 90% and reduce borrower fees on most 7(a) and 504 loans.
https://www.sba.gov/article/2016/aug/24/statement-administrator-mills-urging-continued-support-small-businesses-recovery-loan-programs
U.S. Congress. Small Business Jobs Act of 2010.
Used to provide policy context for the post-recession lending period, including the increase in the maximum standard 7(a) loan amount from $2 million to $5 million.
https://www.congress.gov/bill/111th-congress/house-bill/5297
U.S. Small Business Administration, Office of Inspector General. Evaluation of the CARES Act Debt Relief to 7(a) Borrowers.
Source for pandemic-era program context, including debt-relief payments made to existing 7(a) borrowers under Section 1112 of the CARES Act.
https://www.sba.gov/document/report-21-03-evaluation-cares-act-debt-relief-7a-borrowers
U.S. Small Business Administration, Office of Inspector General. White Paper: 7(a) Loan Program During SBA’s Response to the COVID-19 Pandemic.
Used to contextualize the FY2021 lending anomaly and independently compare changes in loan dollars, average loan size, approvals, defaults, and charge-offs during the pandemic period.
https://www.sba.gov/document/report-23-05-white-paper-7a-loan-program-during-sbas-response-covid-19-pandemic
U.S. Small Business Administration. SBA Administrator Guzman Announces $44.8 Billion Through Signature Lending Programs.
Used as an external program-level reference for FY2021 lending activity. SBA reported nearly 52,000 7(a) loans totaling more than $36.5 billion during FY2021.
https://www.sba.gov/article/2021/oct/29/sba-administrator-guzman-announces-448-billion-through-signature-lending-programs
U.S. Small Business Administration, Office of Capital Access. Business Loan Program Improvements.
Source for 2023 changes to 7(a) eligibility, underwriting, documentation, and processing, including expanded simplified underwriting options for loans of $500,000 or less.
https://www.sba.gov/article/2023/08/10/business-loan-program-improvements
U.S. Small Business Administration. SOP 50 10 8 and Lender Resources.
Source for 7(a) program requirements that became effective in June 2025 and form part of the policy environment at the study’s FY2025 monitoring baseline.
https://www.sba.gov/sba-lenders/

